

At Passion Minds Pvt Ltd, we help businesses ensure their analytics setup is accurate by answering the crucial question: is GA4 Correctly Installed on your website? A proper GA4 installation is essential to track real user behavior, measure conversions, and make data-driven marketing decisions.
If GA4 is not configured correctly,Passion Minds will help you You otherwise you may miss valuable insights, face reporting errors, and lose opportunities to optimize your campaigns. Our experts thoroughly audit your GA4 setup, verify tracking codes, events, and data flow, and ensure everything works seamlessly so you can rely on precise and actionable analytics for business growth.
Is My GA4 Tracking Setup Correct?
Picture this. You launch a new campaign, spend time and money to get the word out, and then log into Google Analytics 4 (GA4) to see results… only to find zero visitors.
That’s the moment when you start asking: Is my GA4 even working?
Here’s the thing: setting up GA4 is just step one. If it isn’t tracking properly, your data won’t mean much. The good news is you don’t need to guess. You can check your setup in a few simple steps. Let’s break it down.
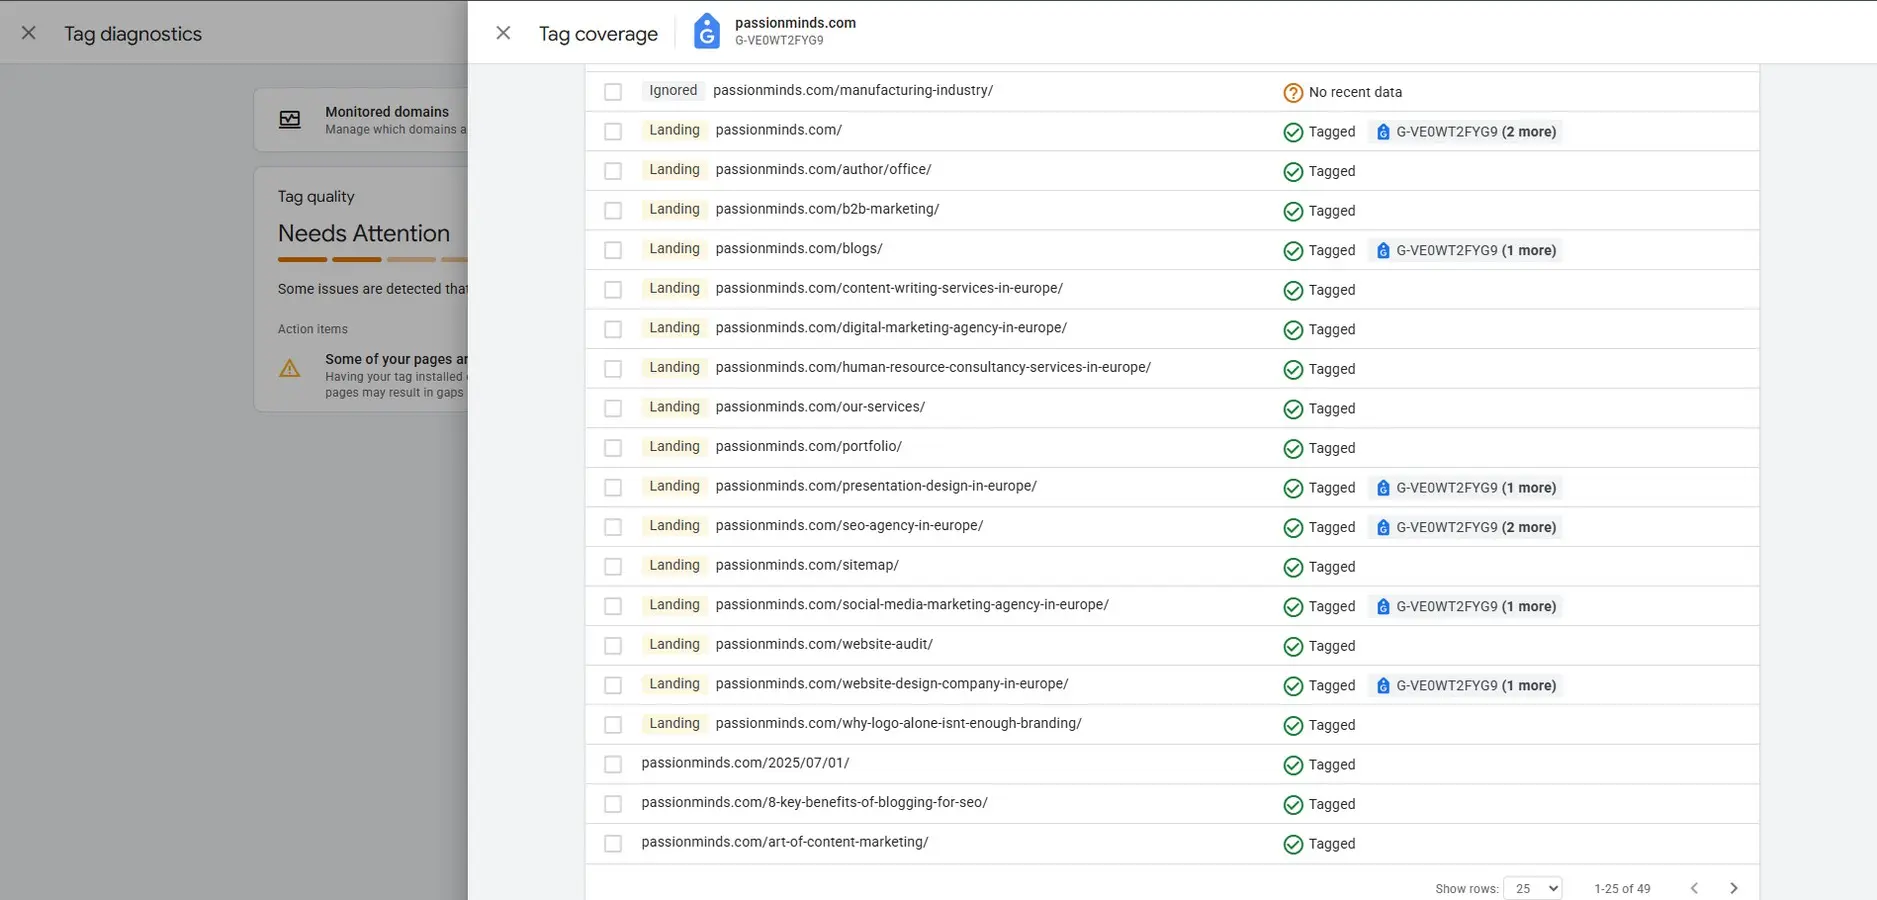
Step 1: Check if your GA4 tag fires
If you’re using Google Tag Manager (GTM), open it and hit Preview. Enter your site’s URL, and you’ll see your site load in debug mode. Back in Tag Assistant, look at the GA4 tag status.
What you want to see is success. If it says Still Running or shows errors, something’s off.
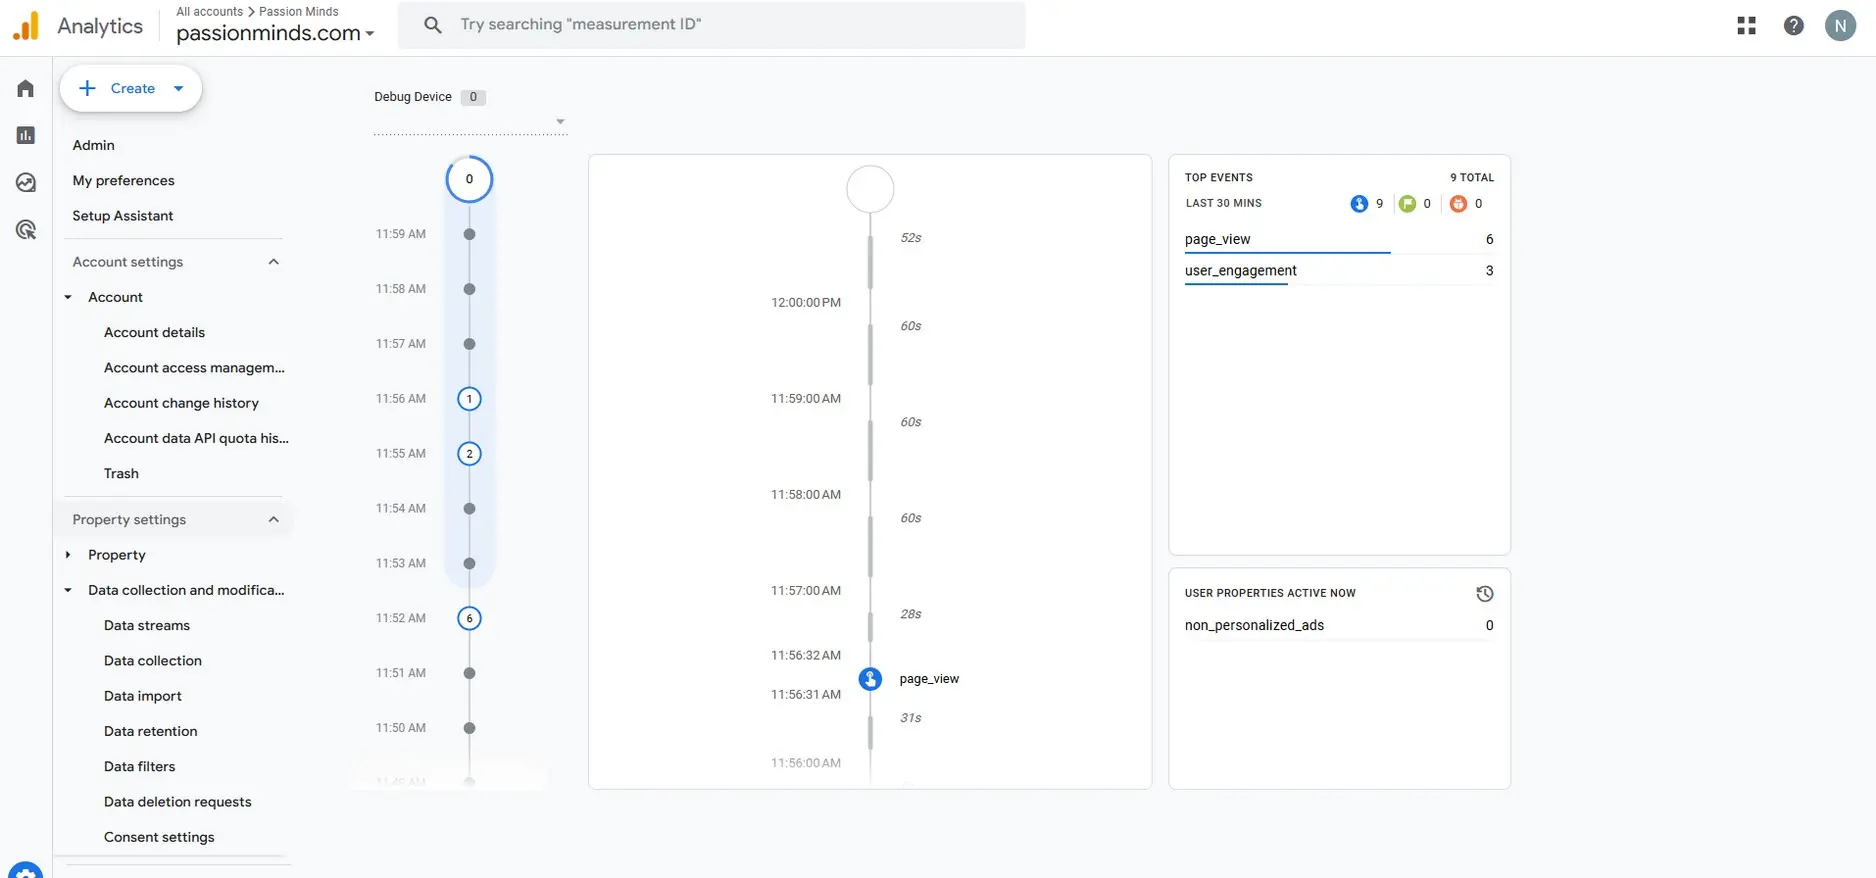
Step 2: Look inside DebugView
Now jump into GA4. Go to Admin > DebugView. Refresh your site or click around and watch events show up.
Here’s what you’re looking for:
- Events like Page View every time you load a page
- Custom events, like button clicks, with the right labels
- Parameters such as page title and URL that match what you expect
If Debug View looks empty, your setup isn’t firing properly.
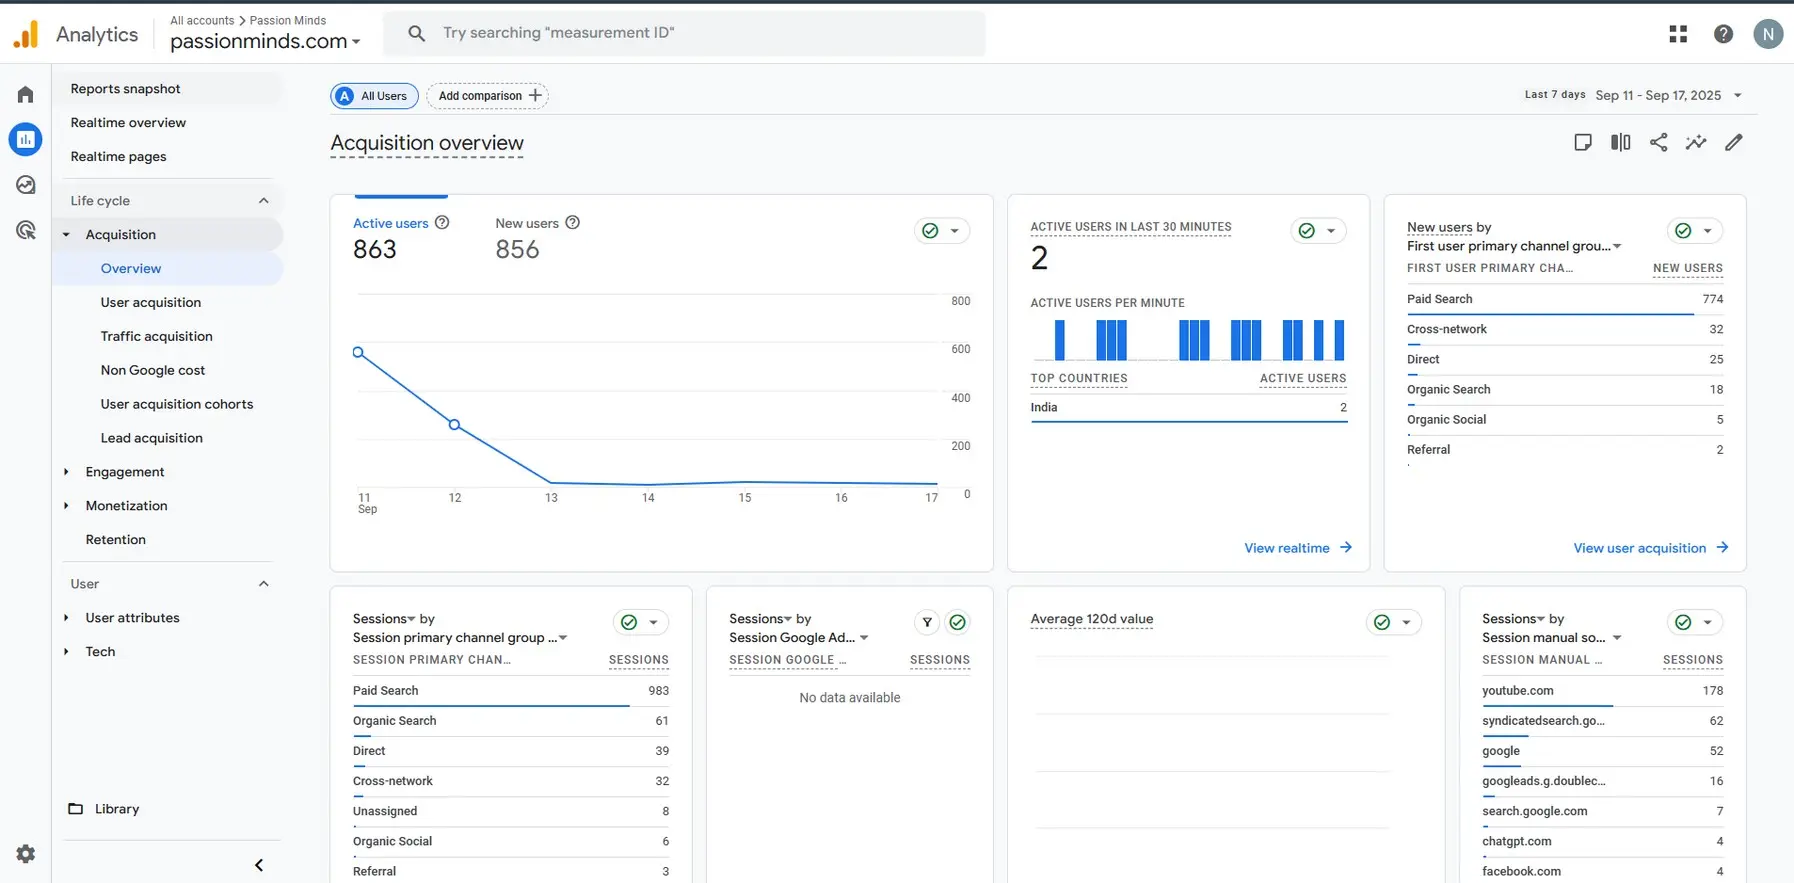
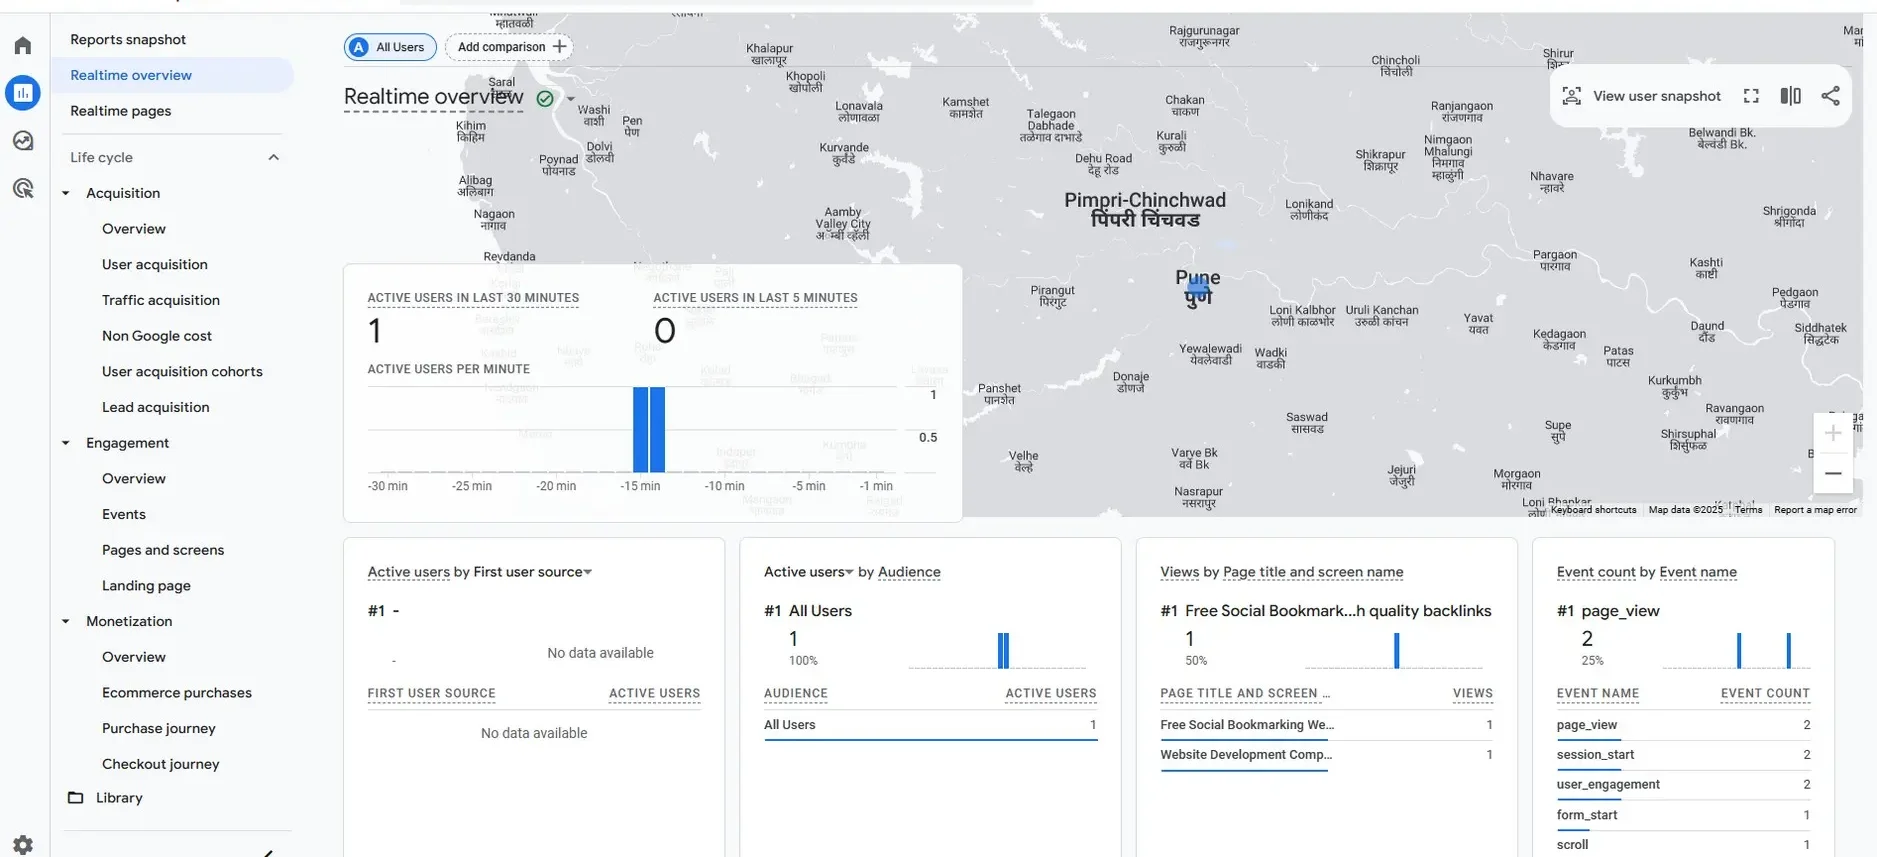
Step 3: Use real-time reports
In GA4, go to Reports > Realtime. This view shows how many people are on your site right now, where they came from, and what they’re doing.
If you know your site has traffic but GA4 shows nothing, then something’s broken.
Step 4: Double-check in browser tools
For a quick technical check, open your site in Chrome. Right-click → Inspect → Network tab. Type in your GA4 Measurement ID (G-XXXXXXX).
If you see requests with status 204, that means GA4 is receiving your data. No requests or errors? Then your tag isn’t working right.

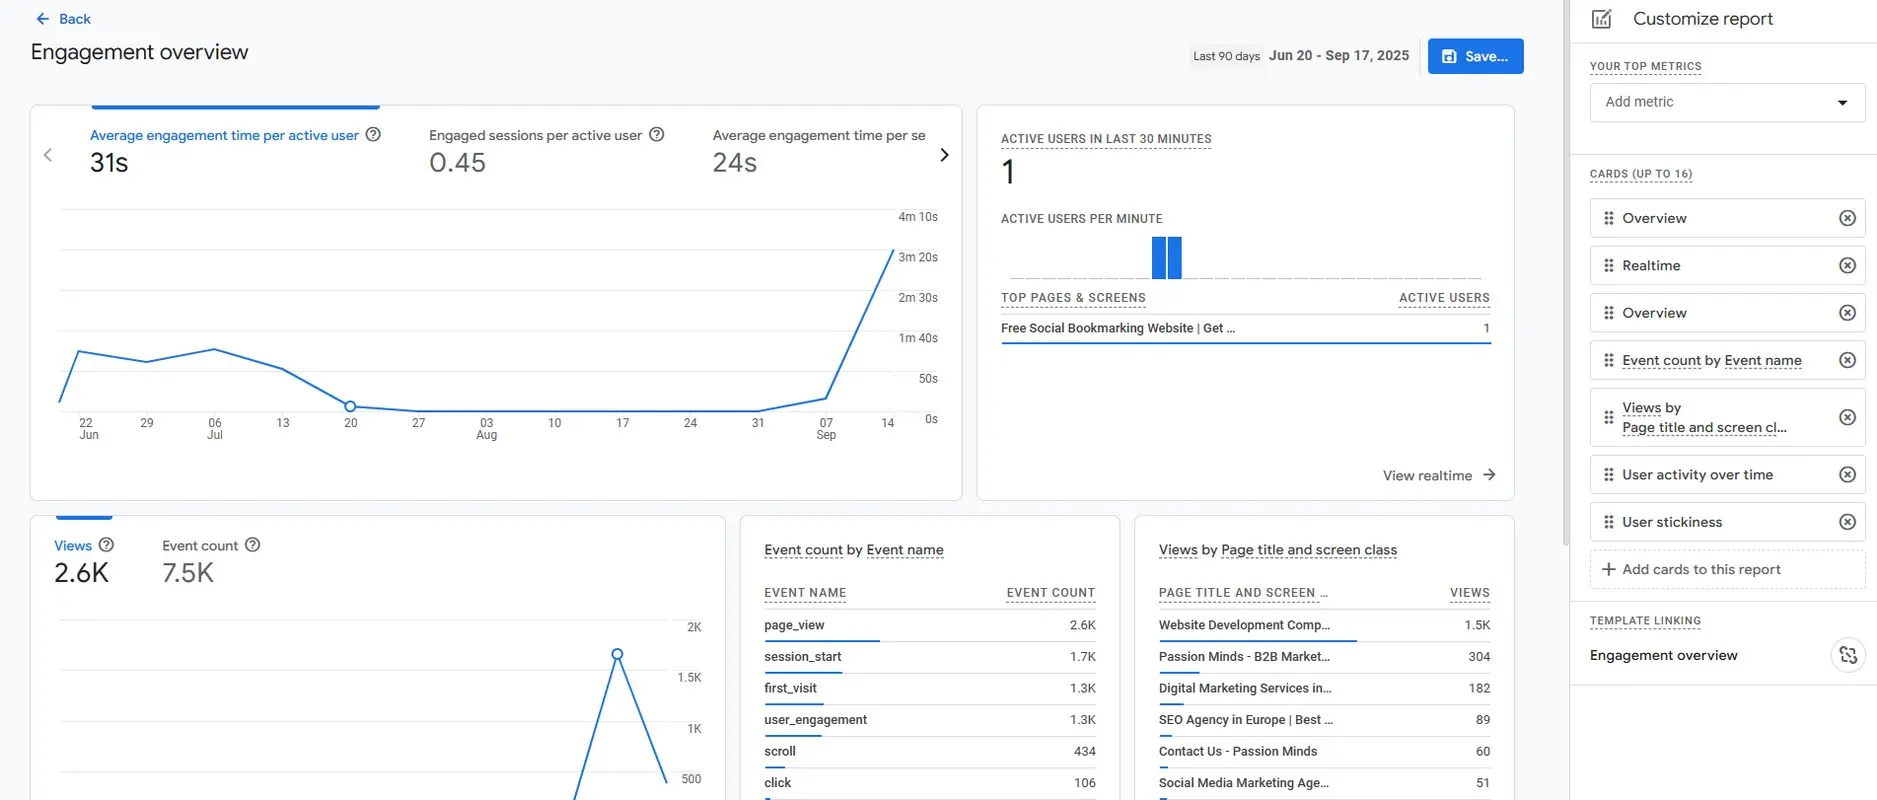
Step 5: Wait for reports to update
Not everything in GA4 shows instantly. Real-time reports update within seconds, but standard reports (sessions, events, conversions) can take up to 48 hours. After a day or two, check Reports and Explore to confirm the data looks right.
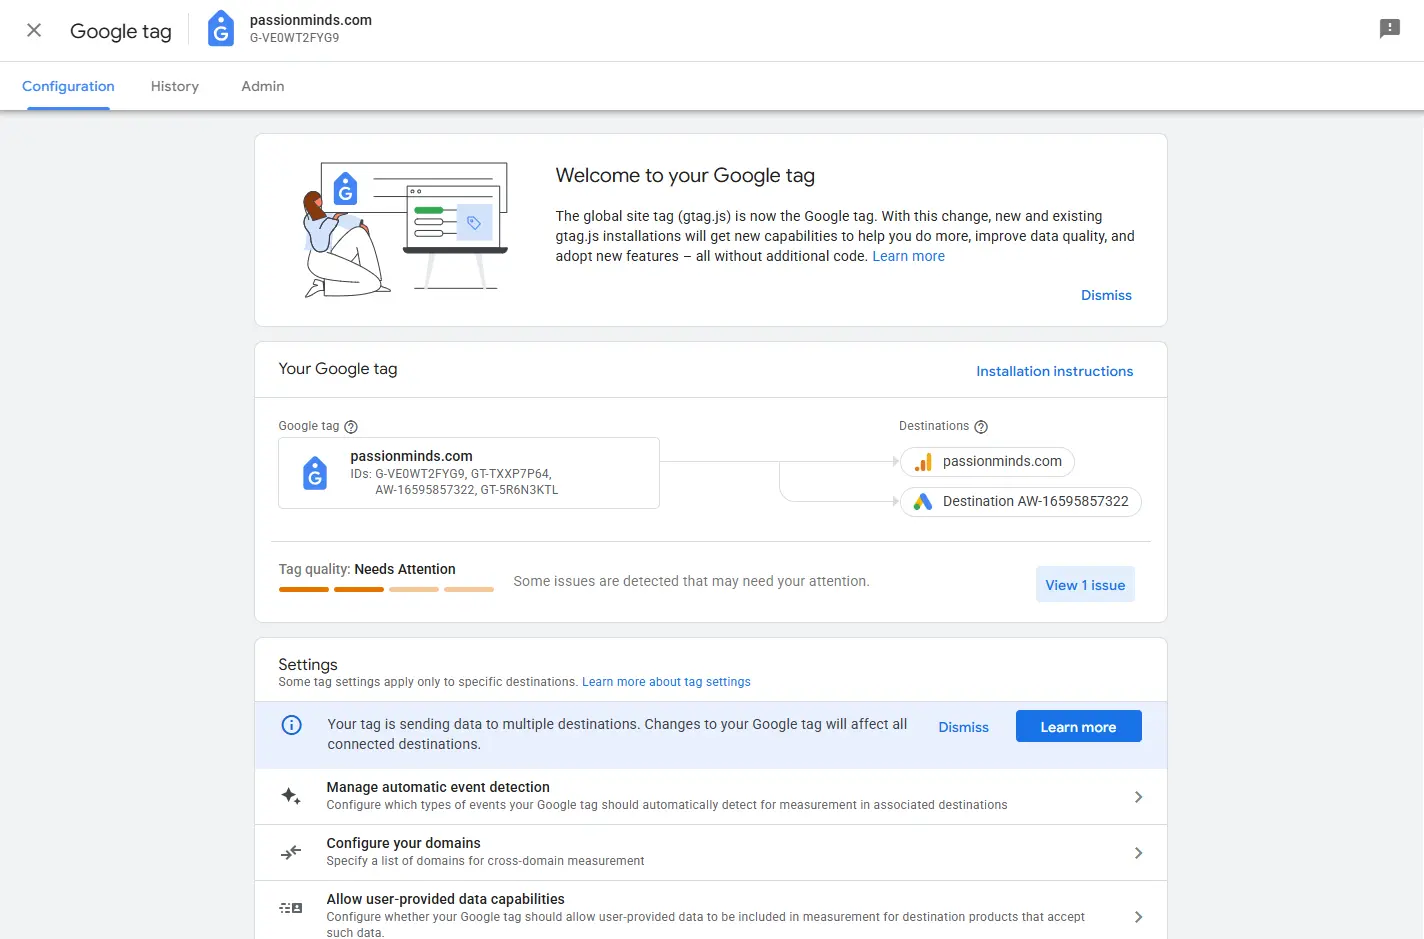
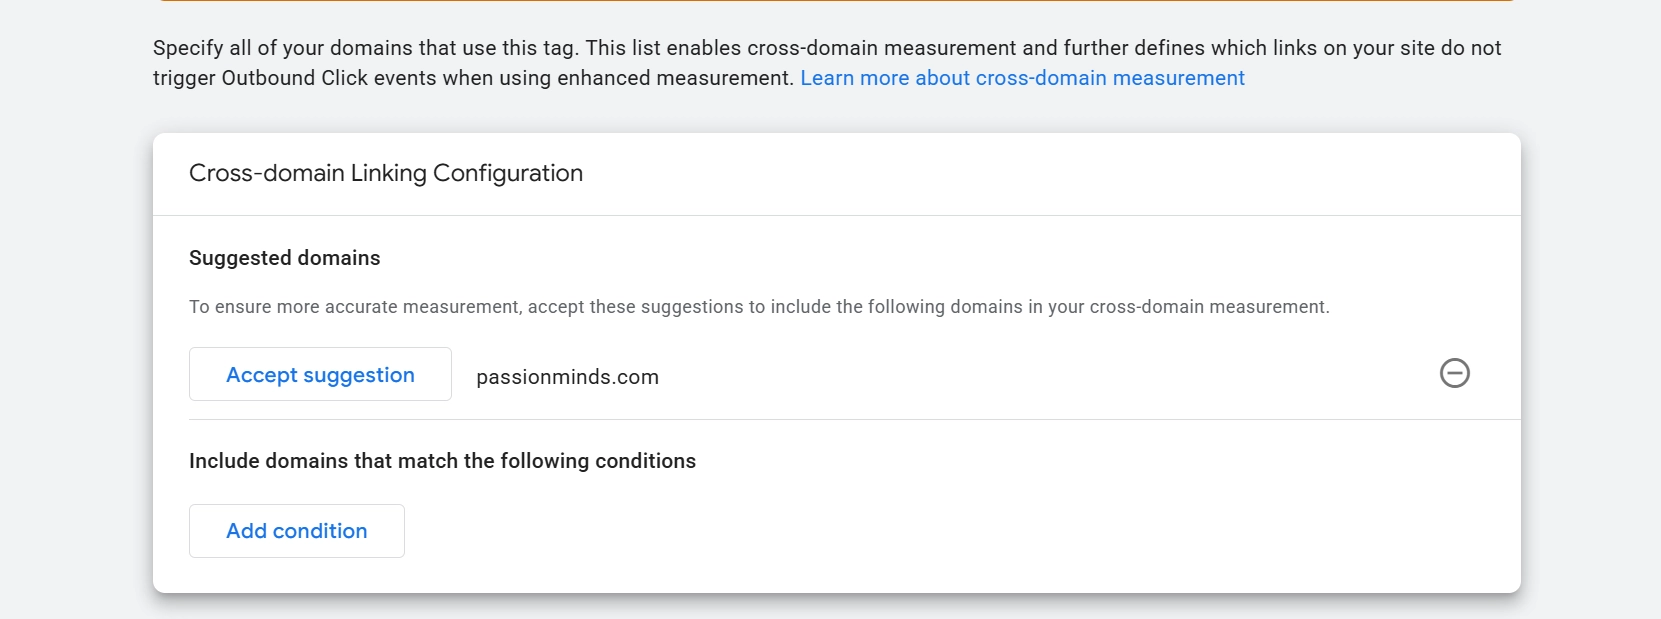
Step 6: Check cross-domain tracking if you need it
Do you have multiple domains, like mywebsite.com and checkout.mywebsite.com? If so, GA4 might treat them as two separate users unless you set up cross-domain tracking.
Go to Admin > Data Streams > More Tagging Settings > Configure Your Domains and add them.
Why Getting GA4 Right Is So Important
If GA4 isn’t set up correctly, you’re flying blind. You might think your campaign failed when in reality, the data just never came through. With these checks, you can trust that what you’re seeing in GA4 reflects what’s really happening on your site.
Your GA4 Health Checklist
- Here’s your quick GA4 checklist:
- Tag fires in GTM Preview
- Events appear in DebugView
- Realtime data shows up
- Network requests are working
- Standard reports reflect your traffic
If you can tick all of these, your GA4 setup is good. If not, at least now you know where to start fixing.
At Passion Minds, we help businesses make sense of their analytics so they don’t waste time chasing the wrong numbers. If you’d like us to take a look at your setup, we’re happy to help.
GTM Preview with GA4 Tag (Step 1)
– Open GTM → Preview → enter your site URL → you’ll see the “Tag Assistant Connected” panel.
– When the GA4 tag fires, the status will show Succeeded.
– Easy to capture.
GA4 DebugView (Step 2)
– GA4 → Admin → DebugView.
– Keep your site open in another tab and click around; events like page_view will appear live.
– Screenshot is simple once the events flow in.
Realtime Report in GA4 (Step 3)
– GA4 → Reports → Realtime.
– Open your site in another tab (or ask a colleague to visit at the same time) so at least one user shows up.
– The active user map and event stream are straightforward to capture.
Chrome DevTools with 204 Requests (Step 4)
– Chrome → Inspect → Network tab → filter by your Measurement ID (G-XXXXXXX).
– Refresh the site. You’ll see requests with status 204.
– Screenshot is direct, though the filter bar is a bit small so make sure it’s legible.
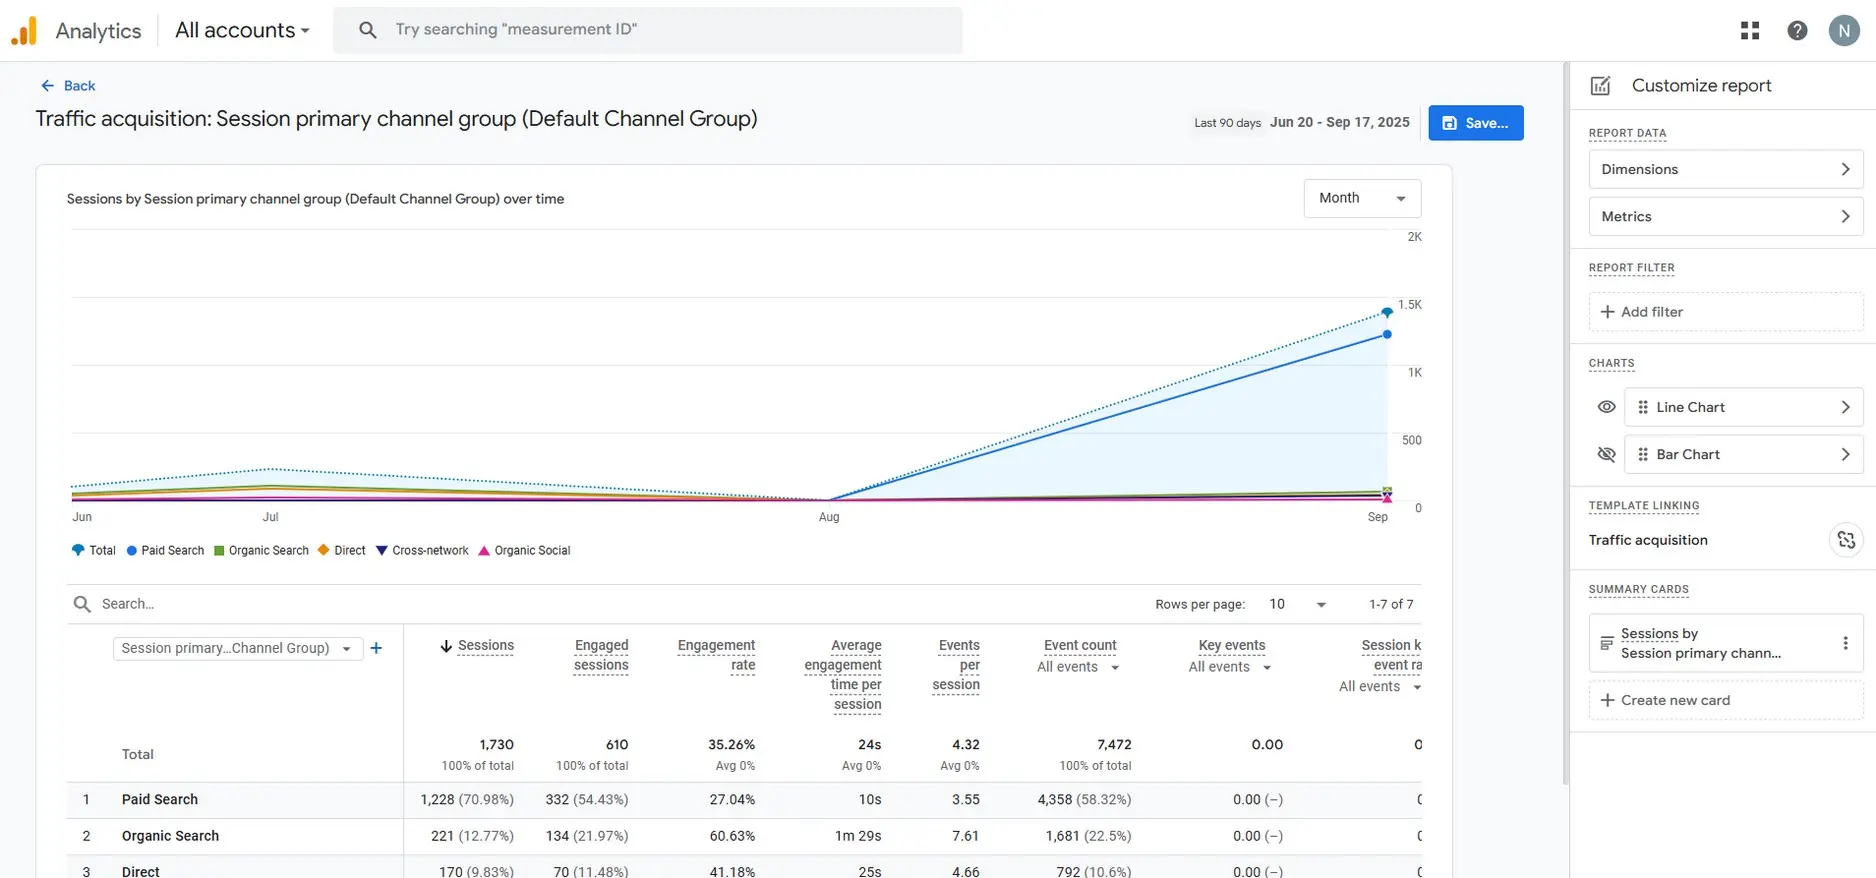
Standard GA4 Report (Step 5)
– GA4 → Reports → Acquisition / Engagement.
– After waiting 24–48 hours for data to show, you’ll see Sessions and Conversions.
– Screenshot is as easy as a normal report view.
Cross-Domain Tracking Screen (Step 6)
– GA4 → Admin → Data Streams → More Tagging Settings → Configure Your Domains.
– This opens the setup screen where domains are listed.
– Simple to capture once you navigate there.
Picture this. You launch a new campaign, spend time and money to get the word out, and then log into Google Analytics 4 (GA4) to see results… only to find zero visitors. That’s the moment when you start asking: is my GA4 even working?
Here’s the thing, setting up GA4 is just step one. If it isn’t tracking properly, your data won’t mean much. The good news is you don’t need to guess. You can check your setup in a few simple steps. Let’s break it down.
Step 1: Check if your GA4 tag fires
If you’re using Google Tag Manager (GTM), open it and hit Preview. Enter your site’s URL, and you’ll see your site load in debug mode. Back in Tag Assistant, look at the GA4 tag status.
What you want to see is Succeeded. If it says Still Running or shows errors, something’s off.
Step 2: Look inside DebugView
Now jump into GA4. Go to Admin > DebugView. Refresh your site or click around and watch events show up.
Here’s what you’re looking for:
- Events like page_view every time you load a page
- Custom events, like button clicks, with the right labels
- Parameters such as page title and URL that match what you expect
If DebugView looks empty, your setup isn’t firing properly.
Step 3: Use real-time reports
In GA4, go to Reports > Realtime. This view shows how many people are on your site right now, where they came from, and what they’re doing.
If you know your site has traffic but GA4 shows nothing, then something’s broken.
Step 4: Double-check in browser tools
For a quick technical check, open your site in Chrome. Right-click → Inspect → Network tab. Type in your GA4 Measurement ID (G-XXXXXXX).
If you see requests with status 204, that means GA4 is receiving your data. No requests or errors? Then your tag isn’t working right.
![]()
Step 5: Wait for reports to update
Not everything in GA4 shows instantly. Real-time reports update within seconds, but standard reports (sessions, events, conversions) can take up to 48 hours. After a day or two, check Reports and Explore to confirm the data looks right.
Step 6: Check cross-domain tracking if you need it
Do you have multiple domains, like mywebsite.com and checkout.mywebsite.com? If so, GA4 might treat them as two separate users unless you set up cross-domain tracking.
Go to Admin > Data Streams > More Tagging Settings > Configure Your Domains and add them.
Why Getting GA4 Right Is So Important
If GA4 isn’t set up correctly, you’re flying blind. You might think your campaign failed when in reality, the data just never came through. With these checks, you can trust that what you’re seeing in GA4 reflects what’s really happening on your site.
Your GA4 Health Checklist
Here’s your quick GA4 checklist:
- Tag fires in GTM Preview
- Events appear in DebugView
- Realtime data shows up
- Network requests are working
- Standard reports reflect your traffic
If you can tick all of these, your GA4 setup is good. If not, at least now you know where to start fixing.
At Passion Minds, We Help Businesses make sense of their analytics so they don’t waste time chasing the wrong Numbers. If you’d like us to take a look at your setup, we’re happy to help.
GTM Preview with GA4 Tag (Step 1)
– Open GTM → Preview → enter your site URL → you’ll see the “Tag Assistant Connected” panel.
– When the GA4 tag fires, the status will show Succeeded.
– Easy to capture.
GA4 DebugView (Step 2)
– GA4 → Admin → DebugView.
– Keep your site open in another tab and click around; events like page_view will appear live.
– Screenshot is simple once the events flow in.
Realtime Report in GA4 (Step 3)
– GA4 → Reports → Realtime.
– Open your site in another tab (or ask a colleague to visit at the same time) so at least one user shows up.
– The active user map and event stream are straightforward to capture.
Chrome DevTools with 204 Requests (Step 4)
– Chrome → Inspect → Network tab → filter by your Measurement ID (G-XXXXXXX).
– Refresh the site. You’ll see requests with status 204.
– Screenshot is direct, though the filter bar is a bit small so make sure it’s legible.
Standard GA4 Report (Step 5)
– GA4 → Reports → Acquisition / Engagement.
– After waiting 24–48 hours for data to show, you’ll see Sessions and Conversions.
– Screenshot is as easy as a normal report view.
Cross-Domain Tracking Screen (Step 6)
– GA4 → Admin → Data Streams → More Tagging Settings → Configure Your Domains.
– This opens the setup screen where domains are listed.
– Simple to capture once you navigate there.


Comments are closed